Americans gave a record $557 billion in charitable gifts during 2023, according to estimates provided by the Lilly Family School of Philanthropy at Indiana University in Giving USA 2024, The Annual Report on Philanthropy for 2023, published by the Giving USA Foundation. Giving, on an inflation-adjusted basis, continues to recover after retreating from the all-time peak in 2021. In current dollars, giving from all sources was up 1.9% over the previous year but down 2.1% when adjusted for inflation.
Giving by individuals was estimated to be $374 billion, growing at an annualized rate of 4.3% over the last five years. An additional $43 billion came from individuals in the form of charitable bequest giving, an increase of 4.8% over the previous year. Corporate giving was up 3% to $37 billion. Giving by foundations was estimated at $104 billion, an annualized rate of 8.3% over the last five years. (Note, the Giving USA Report counts new contributions to donor advised funds as individual giving in the year of the contribution. Subsequent distributions from donor advised funds are not reported as foundation giving.)
Before delving further into the numbers and seeking insights into donor behavior, it is important to understand the limitations of the Giving USA Report. It is an estimate – a survey – of charitable giving. Though the headlines tend to focus on single numbers, the report is not a precise tally or scoreboard of total charitable giving. Because the report is an estimate, past reported results are routinely adjusted – sometimes years after the fact – as new data become available.
It is remarkably difficult to answer the simple question, “How much do Americans give to charity each year?” because there are few reliable measuring points for charitable giving. Donors can choose a wide array of ways to make their charitable contributions. Some gifts are deducted on income tax returns, but many are not, so U.S. Treasury data cannot provide a full picture. Professional associations – CASE and AHP among them – survey fundraising results among their members, but their reports reflect sector-specific giving. As discussed below, assessing total contributions from charitable bequests is especially challenging because few estates file estate tax returns and the actual distribution to charity is often spread over a period of years. Tallying donor-advised funds is complicated because there are two transactions involved: one from the individual donor, and another when the sponsoring foundation makes a distribution to the ultimate charitable beneficiary.
Despite these limitations, the Giving USA Report has been conducted and reported consistently for decades. Rather than a mere scorecard for the previous year, the real value of the Report is the interesting glimpses it can provide into Americans’ giving, allowing us to draw inferences about long-term giving trends and the likely impact of current events on giving.
Figure 1 shows the inflation-adjusted totals by source reported over the past 40 years. Although the overall trend has been positive, it is important to note that year-to-year declines are not unusual – sometimes for several years in a row. Over the 40-year period, total giving after inflation has increased an average of 2.9% per year. Giving from foundations has grown the fastest, an average of 6.0% per year. For comparison, 2.5% real GDP growth is considered ideal by the Federal Reserve.
Figure 1
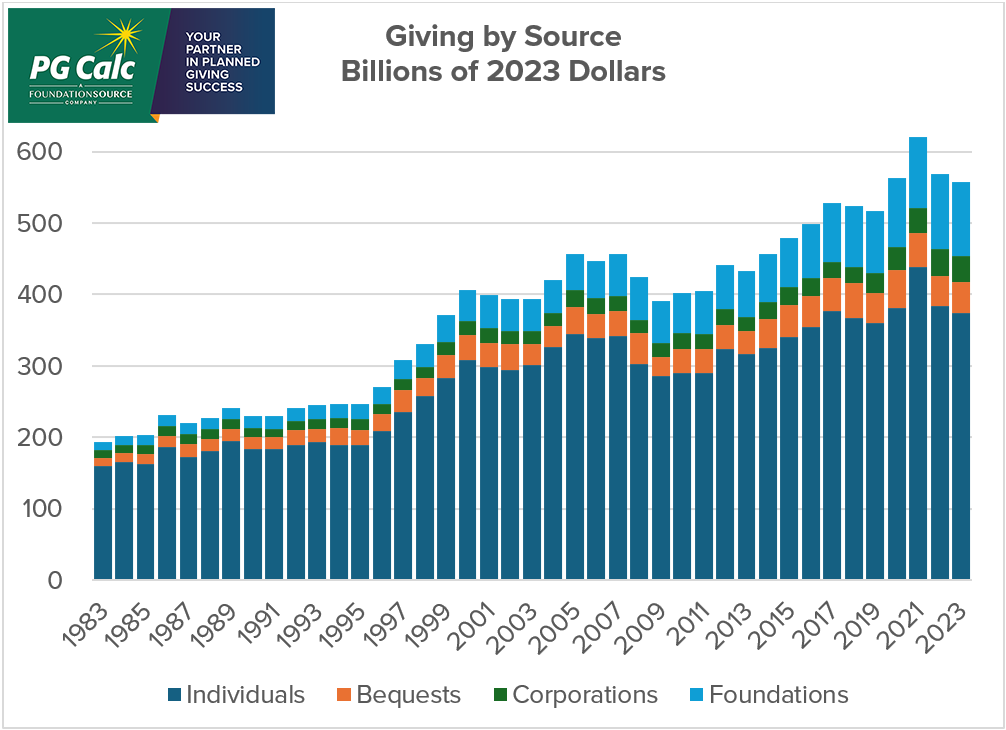
It is interesting to note the ways in which giving has shifted among the sectors over the years. Forty years ago, giving from individuals accounted for more than 80% of total giving. In recent years individuals have accounted for about 65% of the total. Meanwhile, foundations, which accounted for barely 5% of giving in 1983, now account for more than 20%.
Politics and Election Years
Gift planners have debated the impact of tax policy on charitable giving. Some hold that decreasing taxes means potential donors will have more money to give. Indeed, the genesis of the income tax charitable deduction was the concern that donors might curtail their giving as income tax rates increased. However, a counter argument is that lower tax rates reduce the value of the charitable deduction, effectively increasing the after-tax cost of a gift, which puts a damper on giving. It is difficult to discern a consistent pattern in giving following tax changes. Back-to-back tax cuts in 1987 and 1988 slashed the top income tax rate from 50% to 28% and, although giving by individuals dropped initially, it increased in the following years. However, when the top income tax rates were increased from 28% in 1991 to 39.6% in 1993, individual giving increased.
It is interesting, especially in this election year, to consider how giving has been affected by politics and past election cycles. The Giving USA Report indicates mixed and inconsistent impacts on giving in the year following a Presidential election or a shift in the balance of power, as summarized in Figure 2 below.
Figure 2
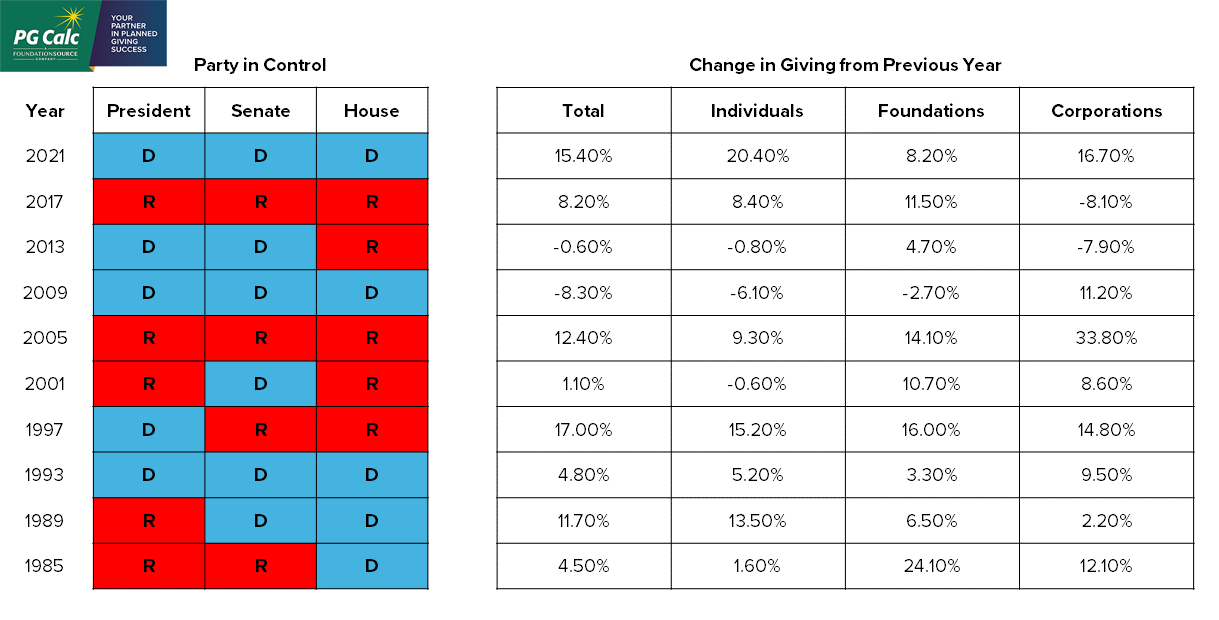
There appears to be little correlation between total giving and the party in the White House or the balance of power in Congress. Some of the largest increases in giving (1997) occurred when a Democrat was President and Republicans controlled Congress. Sometimes single party control is accompanied by significantly increased giving (2021, 2005) but sometimes not (2009). In short, while the election will be front and center during 2024, past experience would suggest the outcome is unlikely to have much impact on giving.
Investment Markets
Many gift planners believe -- and our experience confirms -- that a booming stock market is good for charitable giving. Intuitively, this makes sense: a donor who owns a growing portfolio is more likely to give. The Standard and Poor’s 500 Index is often used as a proxy for the “stock market.” The S&P 500 has been highly variable over the past 40 years with annual total returns (change in market value plus dividends and interest) as high as 37.6% in 1995 and as low as minus 37.0% in 2008 at the beginning of the Great Recession.
The correlation between the S&P 500 total return and total giving is mixed, as shown in Figure 3. In 1995, when the S&P’s total return was positive 37.6%, total giving remained nearly flat, declining 0.3%. On the other hand, in 2008, at the dawn of the Great Recession, the S&P posted a loss of 37.0% but total giving declined less than one fifth that amount, down 7.2%. In 1987 when the S&P 500 suffered its largest single-day loss in history, losing 22.6% in one day, it managed to post a positive total return of 5.3% for the year, and yet total giving declined 4.8% for the year.
Figure 3
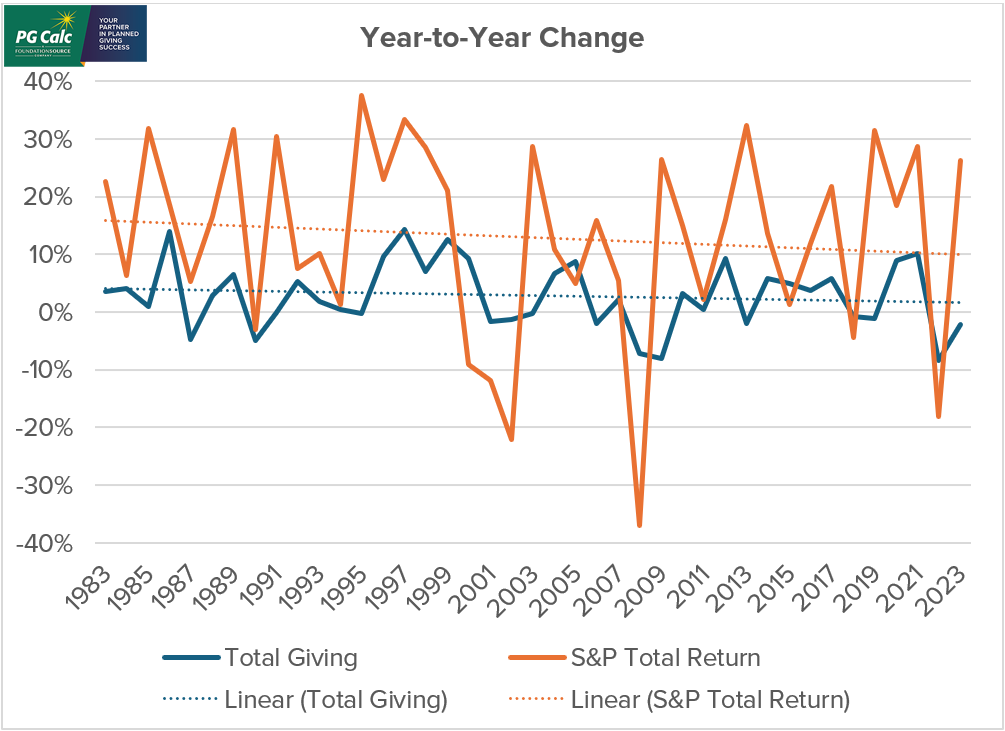
It seems year-to-year changes in total giving are only loosely correlated to the stock market and not nearly as volatile as the market itself. In addition, changes in giving appear to lag market results by a variable amount of time.
Giving as Percent of Income
One of the more elucidating – and often overlooked – sections of the Giving USA Report tracks giving as a percent of income: total giving as a percent of Gross Domestic Product, individual giving as a percent of disposable income, and corporate giving as a percent of pre-tax profits. These data are particularly interesting because they allow an examination of changes due to increases in the economy and income. Alas, the picture is mixed, and has not improved over the years, as shown in Figure 4.
Figure 4
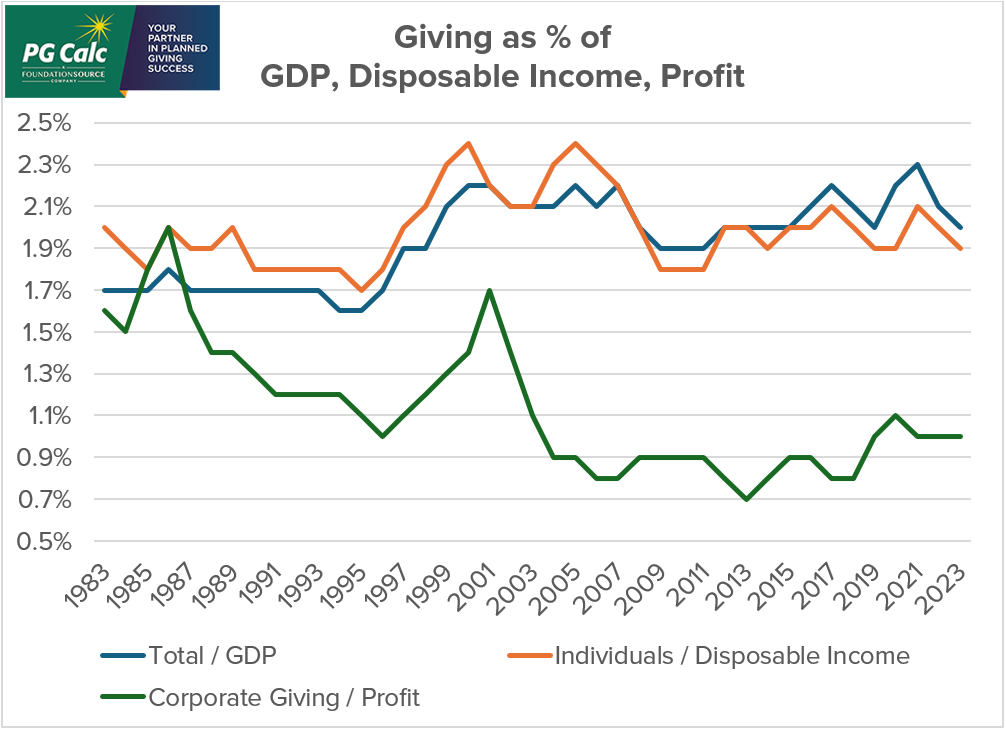
For nearly two decades, both total giving and individual giving have hovered around 2% of GDP and disposable income respectively after having grown modestly during the previous 20 years. These data suggest that the state of the economy and the amount of donors’ disposable income have the most direct impact on giving. However, consider that the share of GDP and disposable income have not changed over the past two decades, a time when many charitable organizations have made significant investments in their fundraising efforts. These data may also be related to the decreasing number of donors in recent years and concerns about the disappearance of the “little donor”.
It is also interesting to note that while corporate profits have grown over the years, the percentage corporations give has decreased and stays perniciously low. In part, this may be due to a trend among corporations to seek alternate modes of giving, focus on fewer but larger gifts to maximize impact, and to be somewhat ambivalent to the charitable deduction.
About those Bequest Numbers
A highlight of the 2023 Giving USA Report is that charitable bequests, at $43 billion, are up 4.8% over the previous year and are the only source that exceeded the rate of inflation. However, as every gift planner knows, anticipating bequest receipts is incredibly difficult. In addition to the unpredictability of the timing of the donor’s death, estate administration is time consuming and the charitable bequests flowing from it can be delayed and spread over many years. These issues affect the Giving USA estimates for charitable bequests too.
For these reasons, Giving USA adopted a complex approach to estimating bequest gifts each year beginning with a preliminary estimate based upon historic data and input from the CASE Voluntary Support of Education (VSE) survey. The initial total is then adjusted in subsequent years as Treasury and other data become available. The bequest results – like all of the numbers reported in Giving USA – are anticipated to be adjusted in the future as better data become available. As might be expected, there can sometimes be significant adjustments to the bequest numbers over several years until the results finally settle in. For example, in 2019 the reported bequest total was $43 billion. However, the 2020 report adjusted that total downward to $38 billion, a reduction of more than 12%. Then, the 2023 report adjusted the total down another 9% to $35 billion.
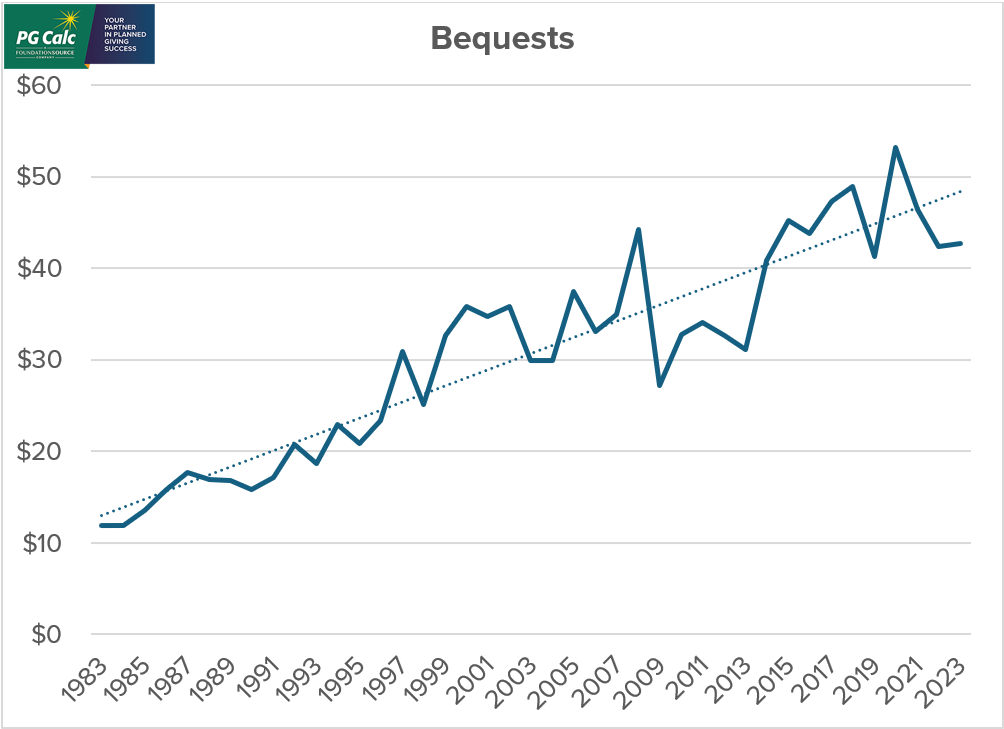
Figure 5 shows the annual estimated giving via charitable bequests. While the increasing trendline is gratifying, the fact is that reported bequest giving has consistently averaged about 10% of individual giving varying only a percent or two from year-to-year.
Figure 5
Conclusion
Like so many other parts of the economy, charitable giving in 2023 continued to recover from the impact of the pandemic, although it has not yet reached the peak achieved in 2021. Giving from individuals continues to be a gradually declining component of total giving.
Reducing the Giving USA Report to a single number focused on annual totals oversimplifies American philanthropy. Nothing in the Giving USA Report should obscure the fact that our donors continue to find reasons to make generous contributions to causes that matter to them. Even as political power shifts, the stock market booms and busts, the economy grows and contracts, and tax laws change in ways favorable and not, our donors continue to give. As gift planners, it is our privilege to help our donors make the smartest gifts possible.